On May 3rd, the Ministry of Culture and Tourism released travel data for the holiday period, showing that domestic tourists reached 274 million and the domestic tourism revenue hit 148.06 billion yuan (US$21.41 billion), both surpassing the same period in 2019.
Online travel platforms, including Ctrip, Tongcheng, Tuniu, and Fliggy, also reported record-breaking data for the Labor Day holiday.
Scenic spots saw a 9-fold increase in ticket sales compared to last year.
According to Ctrip’s “2023 Labor Day Travel Data Report,” the top five popular scenic spots were Shanghai Disneyland Resort, Humble Administrator’s Garden, Huangshan Scenic Area, Mount Emei, and Mount Hua.
Family tourists, particularly those with children, contributed significantly to the surge in visitors, with theme parks, zoos, and museums accounting for more than half of the top ten popular spots.
The preference of tourists diversified during this year’s Labor Day holiday, with a more robust demand for high-level cultural products. Museums such as the Palace Museum, the National Museum of China, Shaanxi History Museum, and others saw their ticket sales fully booked for several consecutive days. Immersive performances, river cruises, and intangible cultural heritage shows were also in high demand.
Cross-provincial travel accounted for more than 70% of hotel bookings, with the average distance traveled by tourists increasing by 25% compared to last year. This year’s holiday saw a trend towards longer trips, with group tours lasting five days or more making up 30% of bookings, up from 20% in 2019.
Besides traditional popular destinations like Beijing, Shanghai, and Hangzhou, smaller destinations like Zibo also witnessed a surge in popularity.
Driven by the phenomenal popularity of “Zibo Barbecue,” hotel bookings in Shandong Province increased nearly threefold compared to the same period in 2019, with Zibo’s hotel bookings increasing more than tenfold.
Experts predict that while the domestic tourism market will stabilize after the Labor Day holiday, the summer peak season will see another surge in student and family travel. However, as some tourists opt for outbound travel during the summer, the domestic tourism heat is expected to be less intense compared to this Labor Day holiday.
To maintain the positive momentum in tourism consumption, local authorities must continue to innovate their offerings, implement more precise branding and marketing strategies, and continuously upgrade their service levels to promote the role of tourism consumption in economic growth.
Gen-Z Insights: capturing attention of China’s post-95s consumers
]]>
The COVID-19 prevention and control policies have a great impact on the tourism and leisure consumption of urban and rural residents across the country. The passenger flow in Jiuzhaigou, Hangzhou West Lake, and other scenic spots decreased significantly compared with previous years.
The domestic tourism revenue reached 64.68 billion yuan, a year-on-year decrease of 42.9%, returning to 44.0% in the same period before the epidemic.
The total number of tourists received in Beijing was 3.061 million, and the total tourism revenue was 1.58 billion yuan. In 2021, Beijing received 8.426 million tourists, with total tourism revenue of 9.3 billion yuan.
Jiangsu has received 8.4519 million tourists, with a total tourism consumption of 4.07 billion yuan. In the “May Day” in 2021, Jiangsu received 35.3757 million tourists, realizing a total tourism revenue of 30.113 billion yuan.
The average occupancy rate of Sanya hotel was 20.57%, a year-on-year decrease of more than 60%.
According to the data of China Index Research Institute, during China’s May Day holiday this year (April 30 to May 4), the transaction of new commercial houses in key monitoring cities decreased by 52.3% compared with last year’s May Day holiday.
According to Pengpai news reports, the transaction scale of new houses in most representative cities decreased year-on-year, with a year-on-year decrease of more than 50% in Wuhan, Suzhou, and Wenzhou.
Gen-Z Insights: capturing attention of China’s post-95s consumers
]]>83.0% of its average MAUs was attributed to Tencent-based platforms with the majority of the traffic coming from WeChat Pay portal and the dropdown list of users’ favorite or most frequently used mini-programs.
The average MPUs increased by 84.5% year-to-year from 14.8 million in the same period of 2020 to 27.3 million, mainly attributable to its stable traffic on WeChat channels. Read our WeChat Mini Programs Insights 2021.
Paying users for the 12-month period ended March 31, 2021, increased by 12.9% year-on-year from 149.9 million in the same twelve-month period of 2020 to 169.3 million. And, Tongcheng Elong’s paying ratio recovered to 11.7% for Q1 2021.
Revenues increased by 60.6% year-to-year to RMB1,613.8 million from RMB1,005.1 million in the same period of 2020.
Compared with Q1 2019, it has achieved 45.0% growth in its domestic room nights sold, with more than 70.0% growth in lower-tier cities, around 20.0% increase in domestic air ticketing volume, and nearly 150.0% increase in bus ticketing volume.
Its total GMV increased by 83.0% year-on-year to RMB33.3 billion.
The adjusted EBITDA increased by 162.7% year-to-year to RMB417.4 million from RMB158.9 million in the same period of 2020. Adjusted EBITDA margin increased from 15.8% in the same period of 2020 to 25.9%.
The adjusted profit for the period increased by 279.5% year-to-year to RMB296.3 million from RMB78.1 million in the same period of 2020. The adjusted net margin increased from 7.8% in the same period of 2020 to 18.4%.
Tongcheng-Elong cooperated with short video platforms to promote its hotel and tourist attraction products. Besides, it has commenced cooperation with a leading e-commerce platform in China by providing its travel-related products and services on the platform, to explore new traffic sources and further penetrate into lower-tier cities market.
It also cooperated with hotels to set up QR code scanning function to convert traffic from offline to its WeChat mini-program.
]]>
Tongcheng-eLong’s average MPUs increased by 21.5% year-to-year from 22.3 million in Q4 2018 to 27.1 million in Q4 2019.
Its revenue increased by 24.4% year-to-year to RMB1,956.5 million in Q4 2019. And, the adjusted EBITDA increased by 47.7% year-to-year to RMB415.1 million. Adjusted EBITDA margin increased from 17.9% YoY to 21.2%.
The adjusted profit for Q4 2019 increased by 67.7% year-to-year to RMB 331.1 million in Q4 2019. The adjusted net margin increased from 12.6% in Q4 2018 to 16.9%.
In 2019, the average MAUs of Tongcheng-eLong increased by 17.1% year-to-year from 175.2 million in 2018 to 205.2 million. And, the average MPUs increased by 34.5% year-to-year from 20.0 million in 2018 to 26.9 million.
The total GMV grew by 26.3% to 166.1 billion yuan in 2019. eLong’s paying ratios also increased from 11.4% in 2018 to 13.1% in 2019.
In 2019, Tongcheng-eLong’s total revenue increased by 21.4% from RMB 6,090.8 million in 2018 to RMB7,392.9 million in 2019.
Adjusted profit for the year increased by 35.4% from RMB1,140.7 million in 2018 to RMB1,544.3 million in 2019 and adjusted net margin for the year was 20.9% in 2019, representing an increase from 18.7% in 2018.
As of December 31, 2019, approximately 85.6% of its registered users resided in non-first-tier cities in China. About 62.4% of newly acquired paying users in WeChat were from tier-3 or lower-tier cities in China, which increased from 61.1% over the same period of 2018.
Currently, WeChat users can access its mini program within the WeChat ecosystem through:
1. WeChat Pay (Wallet) portal and a drop-down list of users’ favorite or most frequently used mini programs, which generated an average MAUs of 113.6 million in 2019, accounting for 65.7% of the total average MAUs of its Tencent-based platforms.
2. Interactive advertisements placed on the Tencent-based platforms, which generated an average MAUs of 37.7 million in 2019, accounting for 21.9% of the total average MAUs of its Tencent-based platforms.
3. The sharing and search functions in WeChat, which generated an average MAUs of 21.5 million in 2019, accounting for 12.4% of the total average MAUs of its Tencent-based platforms.
In addition, the average MAUs in its native apps recorded a faster growth than that in WeChat channel in the second half of 2019, mainly due to the expanding investments in marketing and R&D resources.
As of December 31, 2019, Tongcheng-eLong online platforms offered over 6,800 domestic routes and around 1.4 million international routes operated by more than 400 domestic and international airlines, over 2.0 million hotels selections and alternative accommodation options, approximately 346,000 bus routes, over 500 ferry routes and approximately 8,000 domestic tourist attractions ticketing services.
It has launched an accommodation upgrade service “WeChat Payment Point” with Tencent and an online seat selection service for international flights with China Southern Airlines with the implementation of NDC technology.
For the first quarter of 2020, it expects net revenue to decrease by about 42% to 47% year over year due to COVID-19.
In the first quarter and the whole year of 2020, the number of domestic tourists will decrease by 56% and 15.5% respectively according to China Tourism Academy. 2020 will see a decrease of 932 million person-trips. See the forecast here.
]]>
China’s leading OTA Ctrip officially changed its corporate name to “Trip.com Group Limited” on October 25, 2019, and its ticker to “TCOM” on November 5, 2019. Trip.com Group operates a family of travel brands, which mainly consists of Trip.com, Ctrip, Skyscanner, and Qunar.
Income from Trip.com operations increased by 52% year-over-year to RMB2.2 billion (US$314 million). Excluding share-based compensation charges, non-GAAP income from operations increased by 40% year-over-year to RMB2.6 billion (US$369 million) in Q3 2019.
The operating margin was 21% for Q3 2019, compared to 16% in Q3 2018, and 15% in the previous quarter. Excluding share-based compensation charges, non-GAAP operating margin reached 25%, the highest margin over the past 6 years.
Trip.com Group’s international businesses (excluding Greater China destinations) sustained robust growth momentum.
- The year-over-year revenue growth rate of international hotel business (excluding Greater China destinations) reached 50% in Q3 2019.
- Trip.com brand’s international air ticketing volume maintained triple digit growth for the 12th consecutive quarter.
For the third quarter of 2019, Trip.com Group reported net revenue of RMB10.5 billion (US$1.5 billion), representing a 12% increase YoY. Net revenue for Q3 2019 increased by 21% from the previous quarter.
Accommodation reservation revenue for Q3 2019 was RMB4.1 billion (US$576 million), representing a 14% increase from the same period in 2018, primarily due to its brand’s extensive global reach, expansion in the global product portfolio, and provision of diversified accommodation choices to prospective customers. Accommodation reservation revenue for Q3 2019 increased by 21% QoQ, primarily due to seasonality.
Transportation ticketing revenue for Q3 2019 was RMB3.7 billion (US$521 million), representing a 3% YoY, primarily due to an increase in international air ticketing and ground transportation ticketing demands. Transportation ticketing revenue for Q3 2019 increased by 9% QoQ, primarily due to seasonality.
Packaged-tour revenue for Q3 2019 was RMB1.6 billion (US$229 million), representing a 19% increase YoY, primarily driven by a significant increase in traffic generated from offline stores and further penetration in lower-tier cities in China. Packaged-tour revenue for Q3 2019 increased by 56% QoQ, primarily due to seasonality.
Corporate travel revenue for Q3 2019 was RMB335 million (US$47 million), representing a 26% increase from the same period in 2018, primarily driven by expansion in corporate customer base and an optimized product mix trend. Corporate travel revenue for Q3 2019 increased by 9% from the previous quarter, primarily due to seasonality.
Trip.com gross margin was 79% for Q3 2019 , which remained consistent with that for the same period in 2018 and the previous quarter.
Product development expenses for Q3 2019 increased by 12% to RMB2.8 billion (US$390 million) from the same period in 2018 and increased by 6% from the previous quarter, primarily due to an increase in expenses relating to product development personnel.
Product development expenses for Q3 2019 accounted for 27% of the net revenue for the same period. Excluding share-based compensation charges, non-GAAP product development expenses for Q3 2019 accounted for 25% of the net revenue for the same period, which increased from 24% in Q3 2018 and decreased from 28% in the previous quarter.
Sales and marketing expenses for Q3 2019 decreased by 8% to RMB2.5 billion (US$347 million) from the same period in 2018, primarily due to a decrease in expenses relating to sales and marketing activities. Sales and marketing expenses increased by 18% from the previous quarter, primarily due to an increase in expenses relating to sales and marketing activities.
Sales and marketing expenses for Q3 2019 accounted for 24% of the net revenue for the same period. Excluding share-based compensation charges, non-GAAP sales and marketing expenses for Q3 2019 accounted for 23% of the net revenue for the same period, which decreased from 29% in Q3 2018 and 24% in the previous quarter.
General and administrative expenses for Q3 2019 increased by 18% to RMB809 million (US$113 million) from the same period in 2018, primarily due to an increase in general and administrative personnel-related expenses. General and administrative expenses remained consistent with the previous quarter.
General and administrative expenses for Q3 2019 accounted for 8% of the net revenue for the same period. Excluding share-based compensation charges, non-GAAP general and administrative expenses accounted for 6% of the net revenue for the same period, which remained consistent with those for the same period in 2018 and decreased from 8% in the previous quarter.
Income from operations for Q3 2019 was RMB2.2 billion (US$314 million), compared to RMB1.5 billion in Q3 2018 and RMB1.3 billion in the previous quarter. Income from operations increased by 52% year-over-year in Q3 2019.
Excluding share-based compensation charges, non-GAAP income from operations was RMB2.6 billion (US$369 million), compared to RMB1.9 billion in Q3 2018 and RMB1.7 billion in the previous quarter. Non-GAAP income from operations increased by 40% year-over-year in Q3 2019.
The operating margin was 21% for Q3 2019, compared to 16% in Q3 2018, and 15% in the previous quarter. Excluding share-based compensation charges, non-GAAP operating margin was 25%, compared to 20% in Q3 2018 and in the previous quarter.
Income tax expense for Q3 2019 was RMB365 million (US$51 million), compared to RMB257 million in the same period of 2018 and RMB336 million in the previous quarter. The change in its effective tax rate was primarily due to changes in the profitability of Trip.com subsidiaries that have different tax rates, including certain non-deductible expenses of the fair value changes in equity securities investments.
Net income attributable to Trip.com Group’s shareholders for Q3 2019 was RMB793 million (US$112 million), compared to net loss attributable to Trip.com Group’s shareholders of RMB1.1 billion in Q3 2018 and RMB403 million in the previous quarter.
Excluding share-based compensation charges and fair value changes of equity securities investments, non-GAAP net income attributable to Trip.com Group’s shareholders was RMB2.3 billion (US$317 million), compared to RMB1.7 billion in Q3 2018 and RMB1.3 billion in the previous quarter.
Diluted earnings per ADS were RMB1.35(US$0.19) for Q3 2019 . Excluding share-based compensation charges and fair value changes of equity securities investments, non-GAAP diluted earnings per ADS were RMB3.70(US$0.52) for Q3 2019 .
As of September 30, 2019, the balance of cash and cash equivalents, restricted cash, short-term investment, held to maturity time deposit and financial products was RMB61.0 billion (US$8.5 billion).
For the fourth quarter of 2019, Trip.com expects the net revenue growth to continue at a year-over-year rate of approximately 8%-13%.
]]>
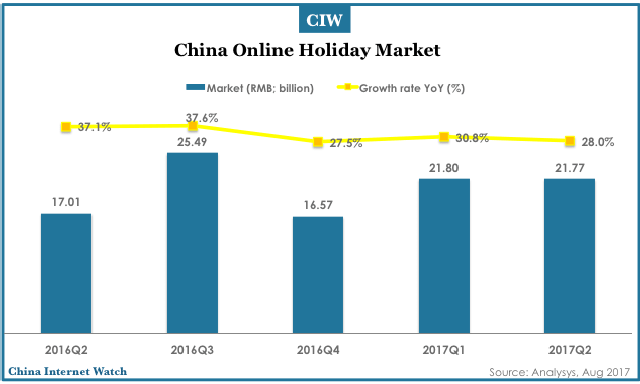
While China’s more affluent consumers increasingly favor independent travel, the online holiday and group tour booking market is still showing rapid growth, likely driven by continued expansion of the middle class in China.
In the second quarter of 2017, China’s online holiday booking market grew to 21.77 billion yuan (US$3.26 billion), equating to year-on-year growth of 28%.
While this figure is slightly lower than that for Q1 2017, this is common as the second quarter in China lacks any long public holidays and opportunities for travel are more limited; traditionally, the first and third quarters are peak season for group tour bookings.
During 2017, the National Tourism Administration has taken measures to combat group tours with unrealistically low prices, believing that these are likely to be low-quality and rely on forcing tourists to engage in activities and shopping for added fees in order to recoup costs.
This policy has come as part of a comprehensive effort to revamp and improve the quality of group tours in China and make high-quality travel more accessible to the burgeoning middle-class, as well as to restrain monopolistic practices and anti-competitive pricing.
Travel e-commerce platforms including Tuniu and Ctrip have responded with their own efforts to increase quality and standardize customer experiences. Ctrip released a new “diamond standard” rating system and released a new high-end line of tours.
Lvmama’s “Happy Donkeyback Travel” line also received an upgrade, wherein the platform began enforcing a “no forced shopping, no hidden costs” program and worked to make sure tour operators weren’t receiving kickbacks and commissions from local sites and retailers.
In addition, market trends towards independent travel are forcing tour providers to move in the direction of greater personalization and more authentic experiences for tourists. Themed tours are becoming more common, including food and minority culture tours.
Capital is continuing to flood the market, with startup “Travel Book” completing A round financing for more than 10 million yuan (US$1.5 million). Travel Book is a building a travel planner and tour guide platform which will help travelers put together optimized itineraries and daily plans for travel on tours and independent trips.
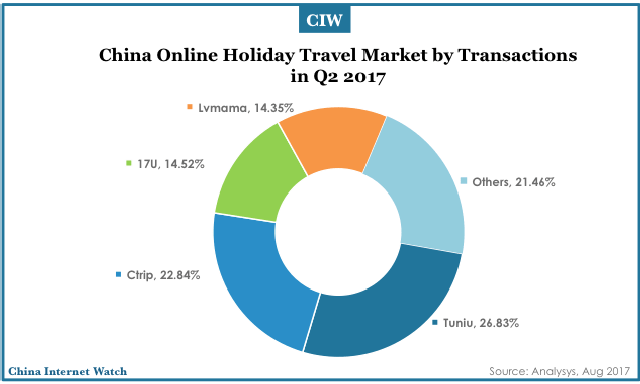
Regarding market share in the second quarter, Tuniu (with 26.83%) and Ctrip (with 22.84%) remain the top two players in the market, sharing half of the market between them. Tuniu has been able to strengthen its supply chain and improve member services, and has earned customer approbation with its strong customer service and professional tour guides.
It’s innovative review system allows customers to compare hotels, sites, and experiences from inside and outside packaged tours to better choose tour packages for themselves. Ctrip is leveraging its acquisition of Qunar to build a better e-commerce platform for tours, and totaled 4.92 billion yuan (US$ 737.6 million) in tour revenue in Q2.
Below the top two, LY.com and Lvmama maintained market shares of 14.52% and 14.35%, respectively. They, too, worked to improve quality and standardization, with Lvmama in particular trying to build a set of personalized and highly diverse tour packages for its customers.
Analysys analysts believe that online holiday market will continue to expand and customer habits continue to develop, as resort packages are being accepted by a wider range of markets.
Given the demand for personalization, enterprises are working to optimize operational efficiency, and continuously drive product and service segmentation and personalized upgrades. Enterprises are moving from business development towards a deeper cultivation of their customer bases, pointing towards a healthy trend of development within the overall market.
]]>
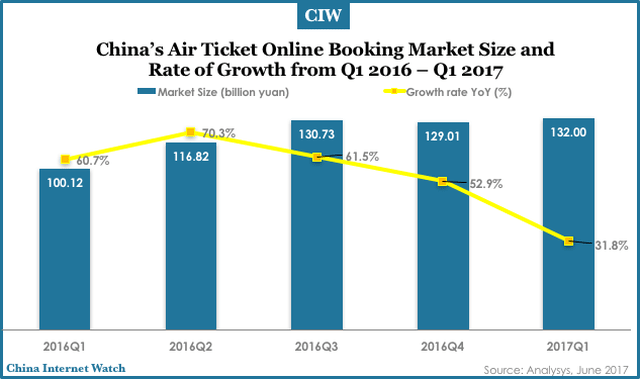
China’s air ticket online booking market is upcoming and on the rise, with seen increases in market share and dominance of certain air divisions, coupled with increased direct sales channels to enhance the pace of growth.
According to Analysys’s released report in Q1 of 2017 on China’s air ticket online booking market, its market size reached 132 billion yuan (US$19 billion), with a year on year growth rate of 31.8%, as seen in the chart below.
Following the July 2016 revised ticket sales policy for the pay-per-month segment vote, each air division is aimed at improving corporate profits, exerting market dominance and directing marketing channels to accelerate the pace, all working with OTA to rectify the ticket agent industry.
This year, the airline continued to strengthen its platform and held sales of the tickets, hotels, tour package through direct channels in order to increase market share.
With each air divisions playing individual strategies with increased intensities, OTA’s profit margins are gradually decreasing. This quarter, while OTA is continuing to enhance product experience and operational efficiency, at the same time, it is also focussing on the layout of higher prices of the international air ticket market.
From engaging in depths of integration, and aspects of upgrading, manufacturers provide more competitive online aviation service products. On the other hand, manufacturers further strengthen the international ticket product and service side of supply through online international voyage and flagship stores.
]]>

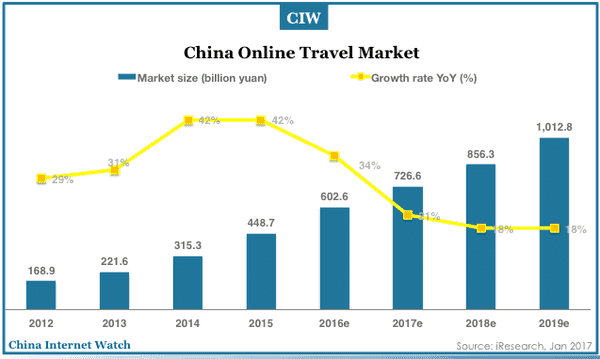
China online travel market totaled 602.6 billion yuan (US$87.46 bn) in 2016 with an increase of 34%. It’s estimated to exceed 1 trillion yuan (US$147 bn) in 2019.
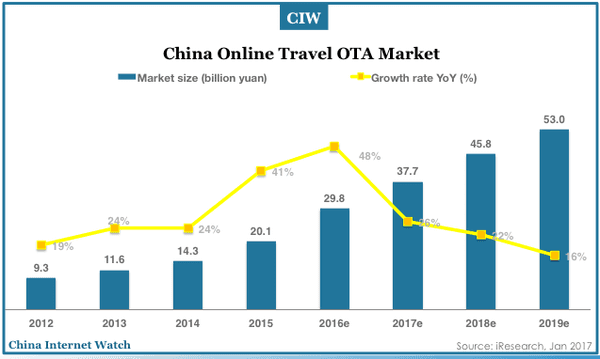
The OTA market in China reached 30 billion yuan (US$4.33 bn) in 2016 and will grow to 53 billion yuan (US$7.69 bn) in 2019 according to iResearch.
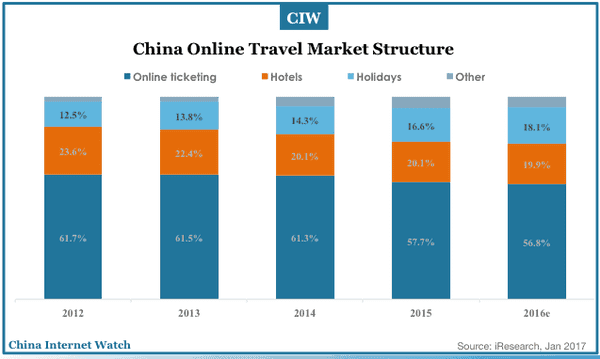
Online ticketing remains the largest section of China’s online travel market(56.8%) in 2016.
China’s domestic travel market reached 4.44 billion person-trips in 2016, an increase of 11% YoY. The corresponding revenues totaled 3.9 trillion yuan with a growth of 14% according to China National Tourism Administration. See China travel market overview 2016 »
]]>
Total transactions of China’s online travel market reached 162.76 billion yuan (US$23.59 billion). OTA revenues totaled 8.19 billion yuan (US$1.19 billion).
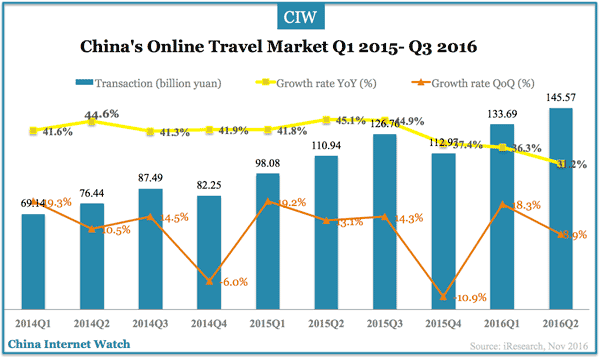
China’s online travel market totaled 162.76 billion yuan (US$23.59 billion) with an increase of 11.8% QoQ or 28.4% YoY. Online travel transactions via mobile apps continued to grow to 62.2% in September 2016 from 59.2% in June 2016.
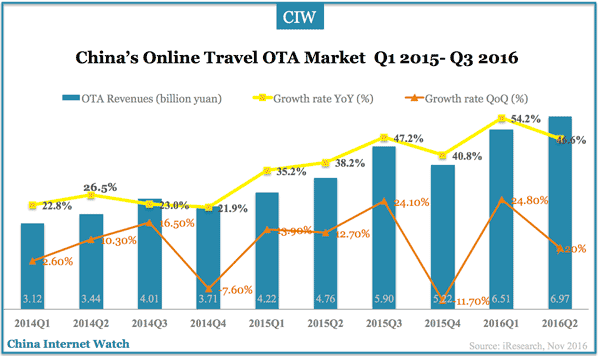
Total revenues in China’s OTA market reached 8.19 billion yuan with a growth rate of 38.7% YoY.
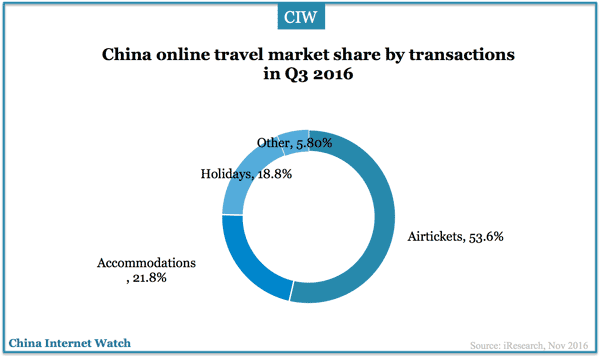
Air tickets booking accounted for 53.6% of China’s online travel transactions in Q3 2016; accommodations 21.8%; and, holiday booking 18.8%.
]]>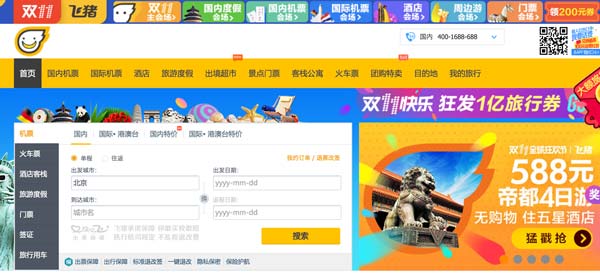
Alibaba announced an upgrade to its OTA platform Alitrip and renamed it to Fliggy (or “Fei Zhu”, flying pig) positioned as a leisure travel brand targeting the young travelers.
Fliggy focuses on outbound tourism market; it cooperates with European countries in a deep level building offline service stations and offering Chinese tourists local services in Chinese.
Fliggy has over 200 million members with more than 10 million daily visitors according to Shaohua Li, CEO of Fliggy.
Alibaba also launched a new product targeting business tourism market on its team collaboration platform Dingtalk (or Dingding) last month. GMV of China’s business tourism market is estimated to reach RMB 600 billion in 2016.
]]>
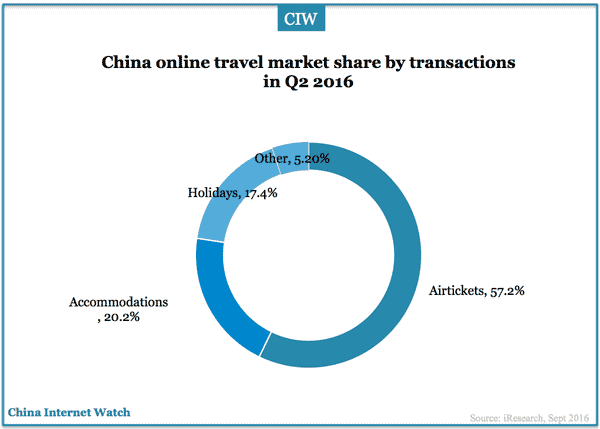
The total transactions of China’s online travel market exceeded RMB 143 billion (USD 21.4 billion) in Q2 2016, an increase of 31.3% YoY or 8.9% QoQ according to iResearch data.
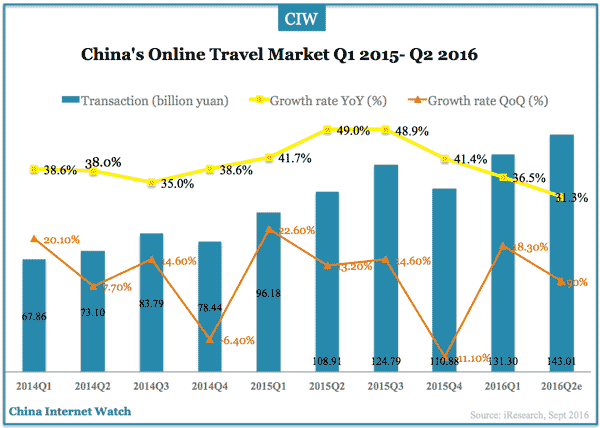
The total revenues of China’s online travel agency market reached RMB 7.04 billion (USD 1.05 billion) in Q2 2016, an increase of 46.1% YoY.
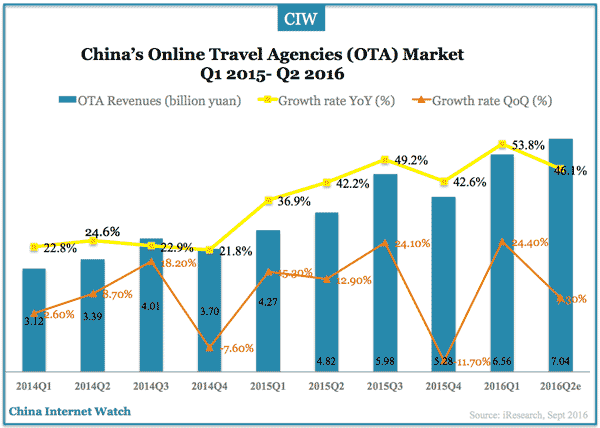
Online booking of air tickets accounts for 57.2% of total online travel market revenues in China.